Creating Specific Graph Types
As alternatives to a standard bar graph, a Bar Graphs interaction may be created as a histogram (Figure 71) or a dot plot (Figure 72). Follow the instructions in the previous sections and use the settings specified below.
Figure 71: Graph Interaction: Bar Graphs: Histogram
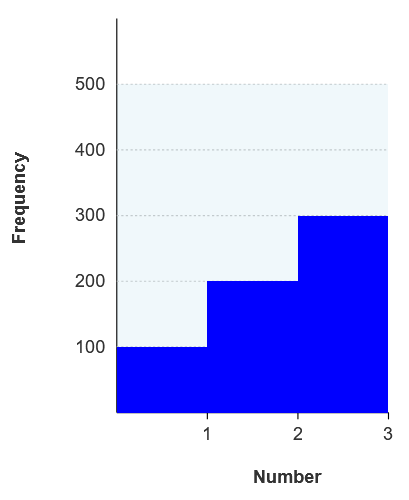
The histogram settings are as follows:
-
Click and drag from the values axis to narrow the graph until the bars are touching.
-
In the Graph sub-tab, mark Show Reference Lines and clear the other checkboxes.
-
In the Axes sub-tab, clear all checkboxes. Set the label alignment to right. Under Category Axis, set the step line type to outside.
-
In the Bars sub-tab, select Bar and Single Bars.
Figure 72: Graph Interaction: Bar Graphs: Dot Plot
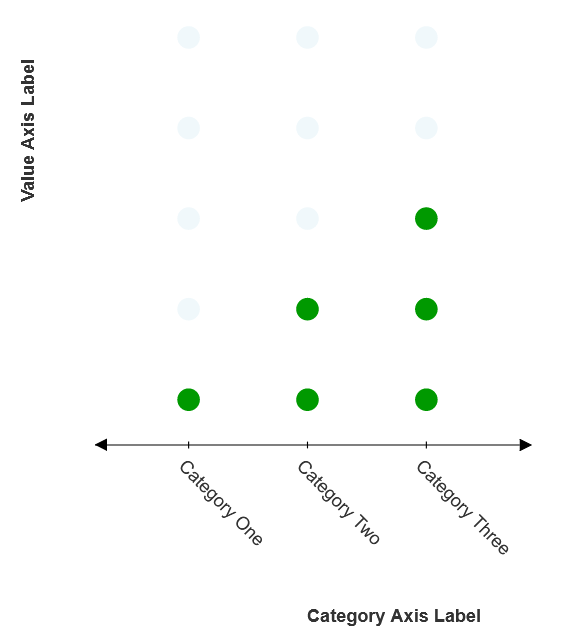
The dot plot settings are as follows:
-
In the Graph sub-tab, clear all checkboxes.
-
In the Axes sub-tab, do the following:
-
Under Category Axis, mark Add Arrow at End and Add Arrow at Origin. Set the step line type to cross.
-
Under Value Axis, clear the checkboxes Add Arrow at End and Add Arrow at Origin. Mark Hide Axis Line. Set step line type to none.
-
Under Values, select Custom and delete the text of each value.
-
-
In the Bars sub-tab, select Shape, then select circle.